
Portfolio

From Breaking News to Breaking Civility: A Study of Toxicity Trends in Political Debates
This project explores toxicity trends in political debates for India and the U.S. using advanced NLP techniques and BERT-based models. A comprehensive dataset was compiled, including over 1000 debate videos for Indian debates from YouTube and 5000+ U.S. debate transcripts from CNN, Fox News, and MSNBC. Debate videos were transcribed using OpenAI’s Whisper for speech recognition and segmented into one-minute intervals to capture granular toxicity scores. Perspective API and a fine-tuned BERT-based model (unitary/toxic-bert) were used for toxicity scoring. Exploratory analysis revealed distinct patterns, such as concentrated toxicity in initial segments of Indian debates and moderate yet explicit language in U.S. debates, showcasing regional hostility trends.
Tags: BERT, HuggingFace, Perspective API, Python, Whisper (OpenAI)

PDF Pal: Your Document Dialogue Companion
PDF Pal is a Python application integrating LangChain and Pinecone technologies, offering a unique approach to interacting with PDF documents. Through natural language conversation, users can effortlessly pose questions about their PDF files, tapping into the extracted text content. By leveraging LangChain’s language model capabilities, the application generates accurate and contextually relevant responses to user inquiries. Pinecone vector database is used to store the embedding vectors and perform similarity search based on the user query. This innovative tool revolutionizes document management, providing an intuitive and dynamic platform for exploring and extracting insights from PDFs.
Tags: HuggingFace, LangChain, Pinecone, PyPDF2, Streamlit

Diabetic Patient Readmission Prediction
Patient Readmission Prediction is a data-driven project aimed at improving patient outcomes in hospitals. It involves analyzing electronic health records from 130 US hospitals over a decade, covering more than 100,000 patients. The dataset, published by UCI, serves as the foundation for creating a robust data pipeline for cleaning and preprocessing the data. By using simple yet effective machine learning algorithms like Logistic Regression, Random Forest, and XGBoost, the project achieved promising results with a 72% F1-score, 81% Precision, and 67% Recall. This predictive model provides hospitals with insights to better manage patient care and reduce readmission rates.
Tags: Jupyter Notebooks, Pandas, Scikit-learn, Seaborn
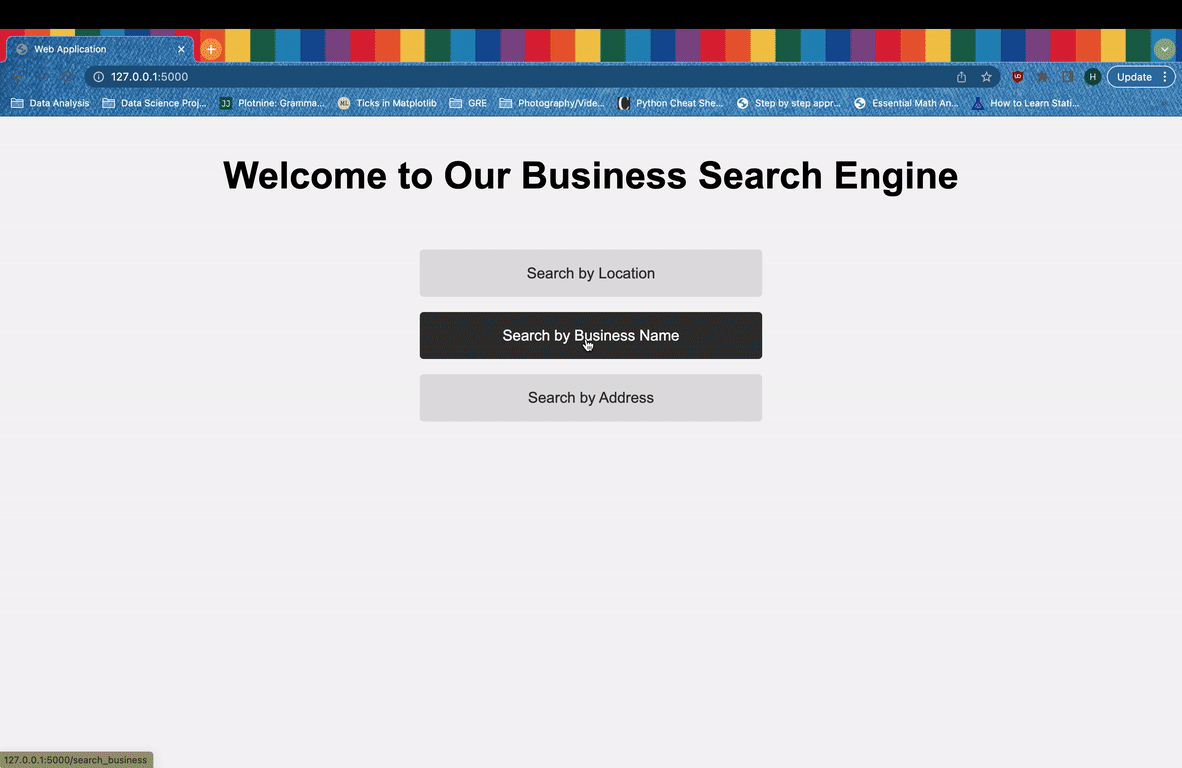
Web Search Application for Google Local Data
This project is a web search application built using Flask and MongoDB that allows users to search data where the Google Local Data is used as the database which contains review information on Google map (ratings, text, images, etc.), business metadata (address, geographical info, descriptions, category information, price, open hours, and MISC info), and links (relative businesses) up to Sep 2021 in the United States.
Tags: Flask, MongoDB, OpenCage, Pandas, Python, Selenium

Exploring My Netflix Journey: Analyzing Viewing History during the Pandemic
Discover the fascinating insights into my Netflix journey during the pandemic. Using Python’s pandas and seaborn libraries, I meticulously analyzed my viewing history from 2020 to 2021. Uncover intriguing trends and witness how my viewing habits evolved over time. Netflix truly became a lifeline during the pandemic, and this project captures my personal experience of content consumption on this revolutionary platform.
Tags: Jupyter Notebooks, Pandas, Python, Seaborn

Real Estate Agent Performance Analysis: Unveiling Top Performers
Embark on a comprehensive exploration of the project, which entails in-depth analysis, visualization, and EDA (Exploratory Data Analysis) of a real estate dataset. By leveraging the CRM platform’s dataset, I meticulously wrangled the data to derive meaningful insights. Visually appealing visualizations provide a clear understanding of agent performance, allowing to develop a robust scoring criteria. Witness the power of data-driven decision-making as it helps identify the top three agents in a brokerage firm, setting new benchmarks in the real estate industry.
Tags: Jupyter Notebooks, Pandas, Python, Seaborn
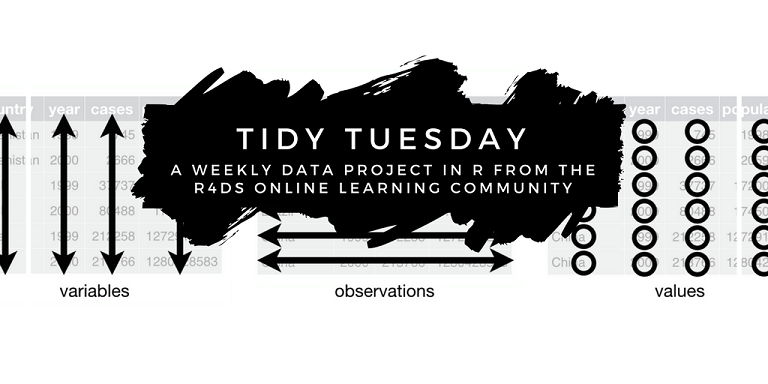
Tidy Tuesday using Python: Exploring Data with Pandas and Plotnine
Step into the world of Tidy Tuesday, a beloved weekly project in the R community, now brought to life in Python. This repository offers a Python implementation of Tidy Tuesday, providing a wealth of diverse datasets for data analysis and visualization purposes. Inspired by David Robinson’s data screencasts, the aim to replicate the experience using Pandas for data handling and Plotnine, a Python library based on the renowned ggplot package, for captivating visualizations.
Tags: Jupyter Notebooks, Pandas, Plotnine, Python